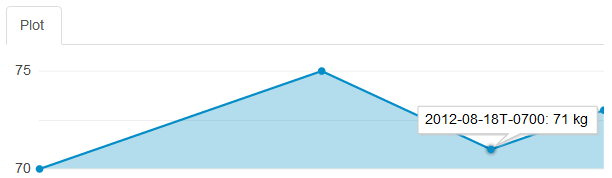
New widget for plotting continuous values. To use it, open your dashboard and click Edit Dashboard. Click Add Widget in one of the areas, and choose Plot. Then open the widget’s Settings and choose the field you want to plot (along with a unit etc).
New widget for plotting continuous values. To use it, open your dashboard and click Edit Dashboard. Click Add Widget in one of the areas, and choose Plot. Then open the widget’s Settings and choose the field you want to plot (along with a unit etc).